I’ve got balanced ventilation in my apartment. It works OK, but I don’t fully understand how it behaves if knobs are pushed and pots are turned, and I’m definitely not sure if its performance is as good as I should expect.
I’m going to do some measurements to see how the system reacts to changes in the outside temperature and tuning of the various settings. The first parameter to measure is the temperature in the air intake, exhaust air and some of the ventilation valves in the different rooms in the apartment.
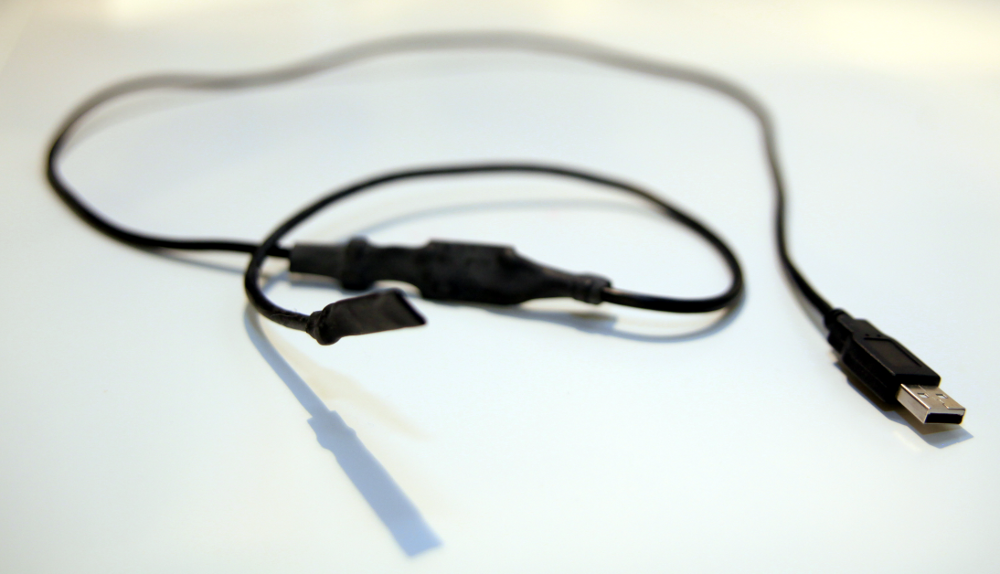
Some temperature sensors are required. Price is an important factor, but so is accuracy. I settled with some sensors from the USBTenki project. Schematics and software are open source, so you can assemble the sensors yourself if you want to. I didn’t want to, so I bought them ready to run from Dracal.
The price is 29.99$ CAD per sensor and they ship internationally. I bought five sensors. In addition, I bought some USB extension cords and a cheap bus powered USB hub from Deal Extreme to allow all sensors to be connected simultaneously.
Munin will be used to create graphs to show the temperature over time:
Munin is a networked resource monitoring tool that can help analyze resource trends and “what just happened to kill our performance?” problems. It is designed to be very plug and play. A default installation provides a lot of graphs with almost no work.
Munin is written in Perl and is available in the repositories of most Linux distributions. Installation is easy:
# Fedora / Redhat / CentOS
sudo yum install munin munin-node

# Debian / Ubuntu
sudo apt-get install munin munin-node
USBTenki host software is used to communicate with the sensors from Linux.
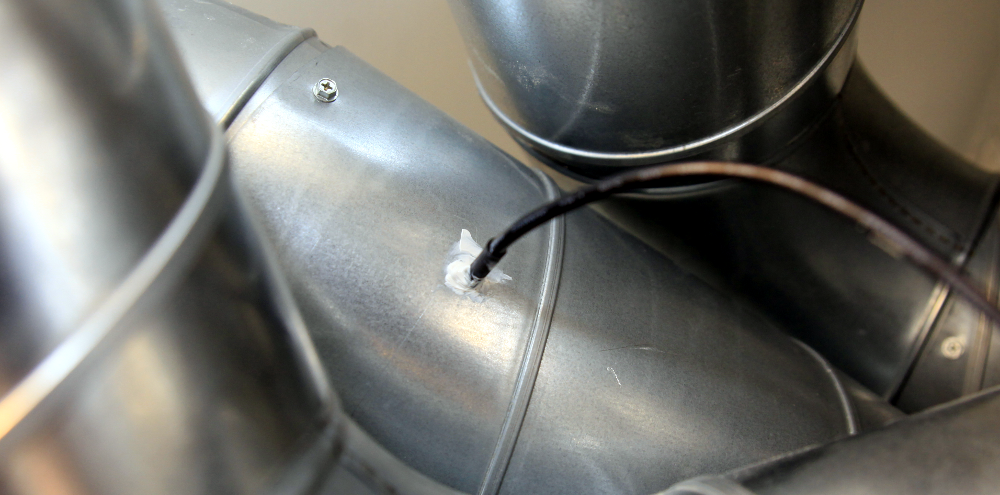
A couple of the sensors are mounted in the ventilation tubes for permanent monitoring, and the other ones are used for temporary monitoring at various locations.
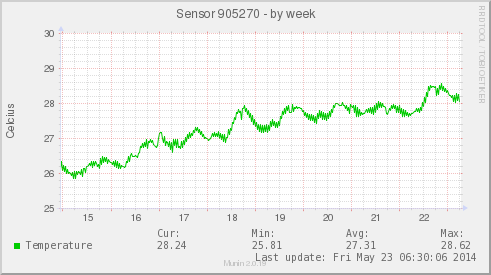
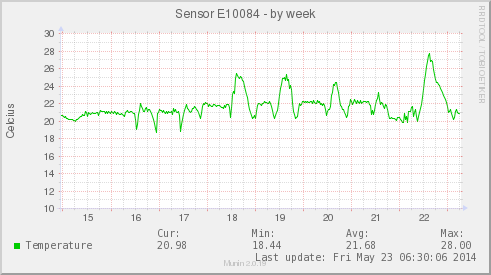
Since the number of sensors and the locations will vary, I need a munin plugin that is flexible. I wrote a simple multigraph plugin that will detect new sensors and create a new graph per sensor that is added. These graphs are completely standardised and (frankly) pretty boring:
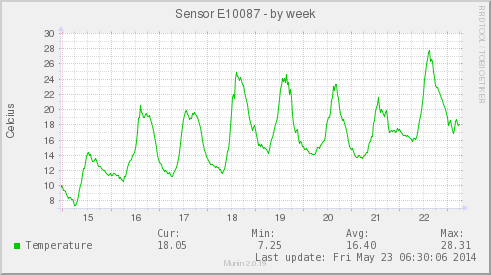
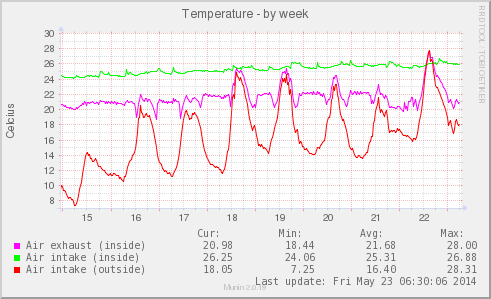
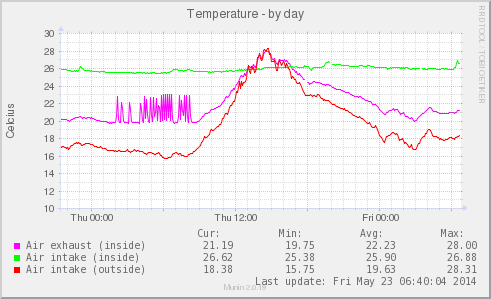
Data loaning is used to aggregate the different sensor data and to modify their presentation (type, colour, label, etc) as I see fit, without having to modify the plugin itself. This will ensure that old sensor data is kept whenever modifications are made, and the data from each sensor can be used in multiple aggregated graphs if needed.
Data loaning configuration example and result:
[sensor;ventilation]
    address 127.0.0.1
    use_node_name no
    temp.update no
    temp.graph_title Temperature
    temp.graph_args --base 1000
    temp.graph_vlabel Celcius
    temp.graph_scale no
    temp.graph_category temperature
    temp.graph_order \
        E10084=oslo;caesar:sensor_E10084.output \
        E10090=oslo;caesar:sensor_E10090.output \
        E10087=oslo;caesar:sensor_E10087.output
    temp.E10084.draw LINE1
    temp.E10084.colour FF00FF
    temp.E10084.label Air exhaust (inside)
    temp.E10087.draw LINE1
    temp.E10087.colour FF0000
    temp.E10087.label Air intake (outside)
    temp.E10090.draw LINE1
    temp.E10090.colour 00FF00
    temp.E10090.label Air intake (inside)
Air flow, carbon dioxide, humidity and power consumption are other aspects that are interesting to monitor as well, but those will have to wait until I find reasonably priced sensors with satisfying accuracy and quality.